Databank (databank.worldbank.org) is an online web resource that provides simple and quick access to collections of time series data. It has advanced functions for selecting and displaying data, performing customized queries, downloading data, and creating charts and maps. Users can create dynamic custom reports based on their selection of countries, indicators and years. All these reports can be easily edited, shared, and embedded as widgets on websites or blogs.
Featured highlights include:
- Simple and quick access to data from 55+ databases
- Enhanced visualizations and reporting capabilities with Excel-like pivot functions
- Data and metadata (definitions and source notes) downloads in multiple formats
- Features to save and share reports – tables, charts and maps
- Features to create reports on subnational databases
- Brand new mapping software, including subnational mapping for selected databases
- Widgets to complement data stories on blogs and web sites
- Social media integration
- Tablet compatibility
- Multilingual – English, French, Spanish, Chinese, and Arabic
- Programmatic access to data and metadata (APIs)
Development Data Group (DECDG)
Email: data@worldbank.org
Web: data.worldbank.org
Twitter: @worldbankdata
How do I select the language?
To select a language, click on one of the five options available: English, Spanish, French, Arabic, and Chinese.
How do I start?
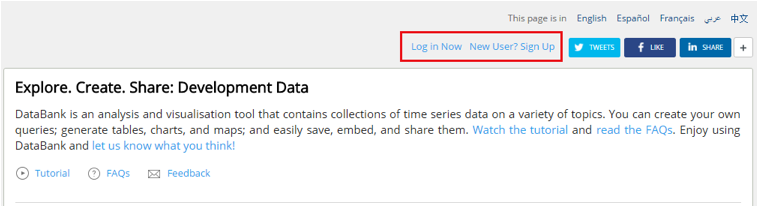
You can use DataBank as a registered or unregistered user. Unregistered users can generate customized reports, view tables, charts, maps and metadata, as well as download data. Registered users also have these options plus the ability to save data selections in the system and render it at any point in time, share tables, charts and maps with other users, and embed data visualizations directly into blogs or websites.
To register, click on the New User? Sign Up » button on the left side of the page. You will be redirected to another page where you can create your account. Once you have created your account, return to the main page and click on Log in Now ».
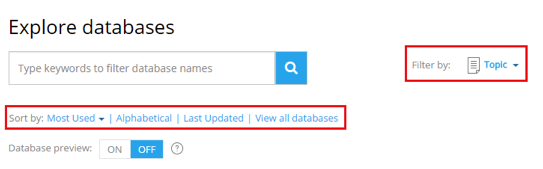
To view databases, click on the Databases tab, or select from the list under Explore Databases.
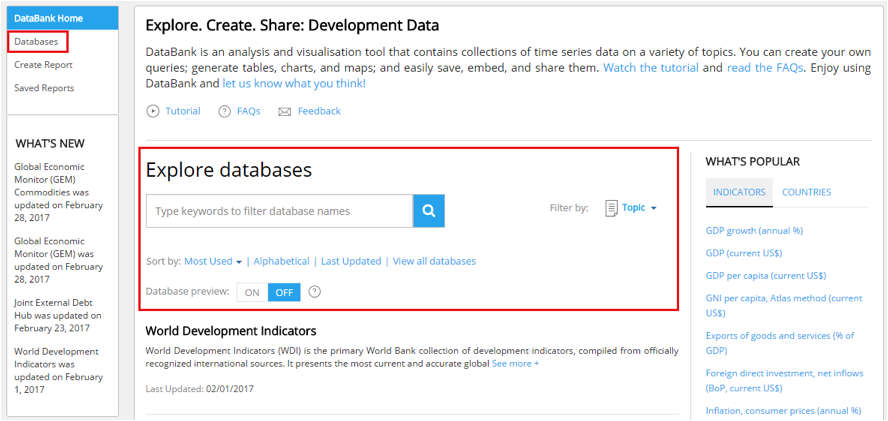
Searches can be simplified using the Filter (Topic and Category) and Sort (Most Used, Alphabetical, and Last Updated) functions of the website, as well as by typing specific keywords in the search box.
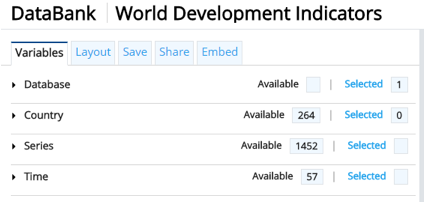
After clicking on a database, you will be directed to the Report page where you can make selections based on the report you want to generate.
How do I switch to another database?
There are two ways to switch databases:
Option 1: Go back to the DataBank home page and click on View all Databases or the Databases tab.
Note: This action will cause you to lose any unsaved data you may be working on.
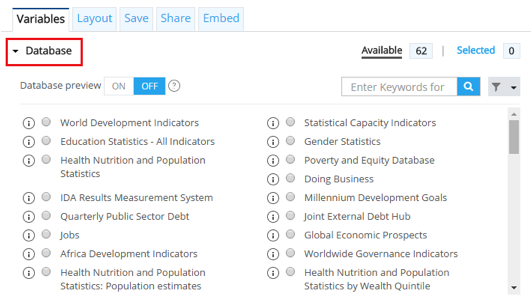
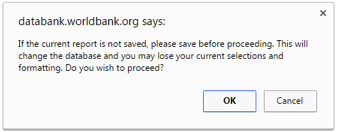
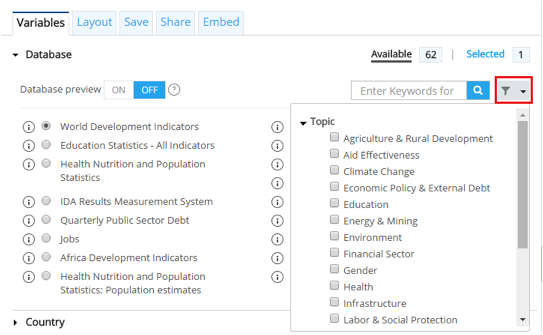
Option 2: Click on the Database section of the Variables tab, and select from the list of available databases. You can view metadata on a database, including its description and the date it was last updated, by clicking on the "information"  icon.
icon.
Note: A warning message will pop up, prompting you to save your report.
How do I choose a database?
There are three ways to do this.
Option 1: Scroll through the list in the Database section of the Variables tab, then click on your selection.
Option 2: Enter the name or code of the database in the search box, then click on your selection.
Option 3: Click on the "Filter" button  and make a selection from the dropdown list. Databases are classified per topic.
How do I create a new report?
You can create a new report by selecting a database. The Database Preview is set to "off", meaning there will be no variables selected when you start your report.
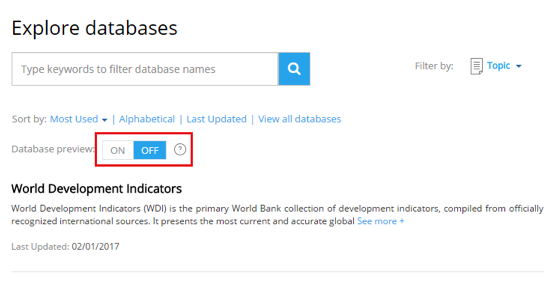
If you wish to learn more about the Database Preview option, click on the "help" icon  beside it.
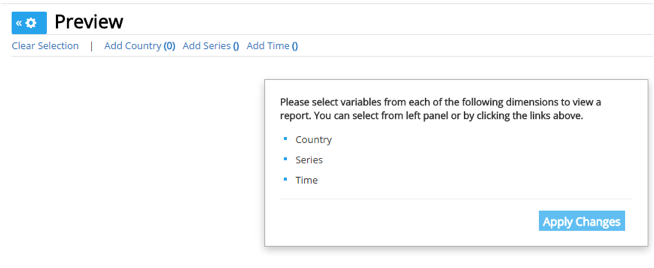
After selecting a database, you will be directed to the Report page and the Preview panel will be empty. You have the option to turn on the database preview, or to start selecting variables for the report you want to create.
How do I clear a report?
There are two ways to clear a report:
Option 1: Click on Clear Selection in the Preview panel of the Report page. This will remove all entries (Country, Series, and Time) from the report.
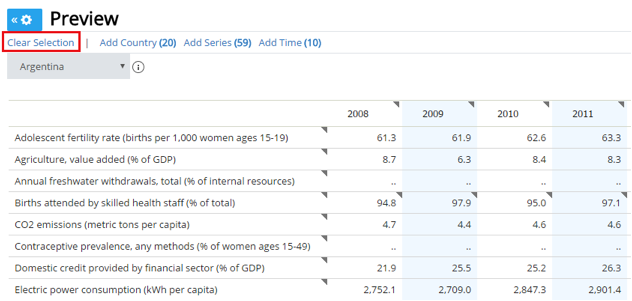
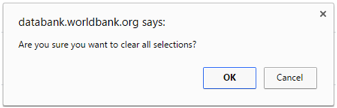
Note: You will be prompted to confirm this action as it cannot be undone.
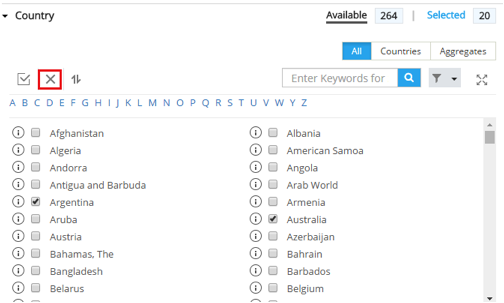
Option 2: Expand the Country, Series, or Time section of the Variables tab, and then click on the "Unselect All" button  to clear entries in those sections only.
How do I select countries?
There are five ways to make country selections:
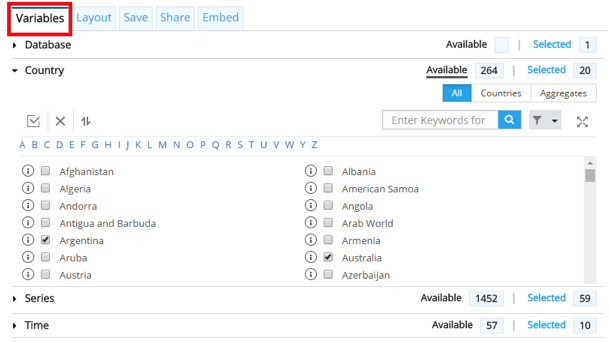
Option 1: Scroll through the list in the Country section of the Variables tab, then check the boxes to indicate your selection.
Option 2: Click on the first letter of the country name in the Alphabet bar, then check the boxes to indicate your selection.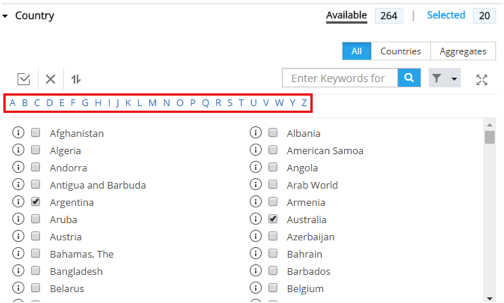
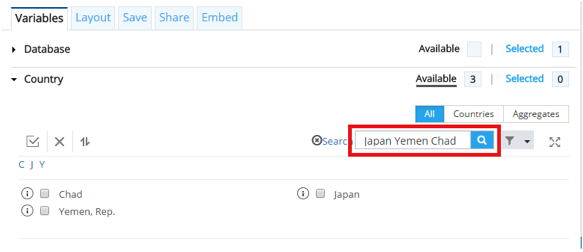
Option 3: Enter the name or code of the country in the search box, then check the boxes to indicate your selection.
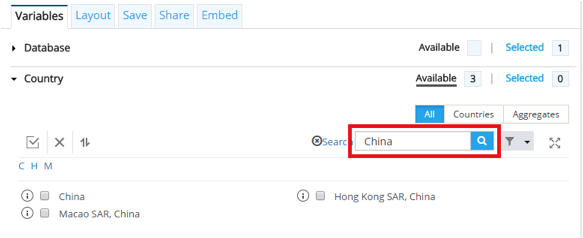
Note: You can search for multiple countries at once.
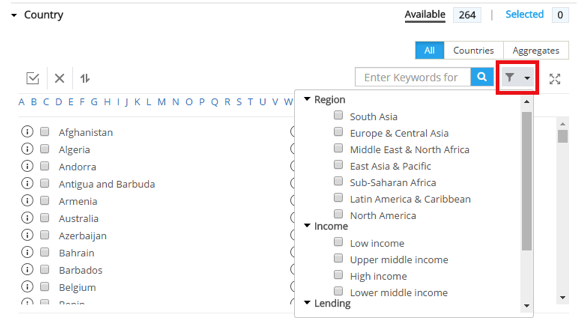
Option 4: Click on the Filter button to display the country list according to specific groups and subgroups, then check the boxes to indicate your selection. Countries are displayed as:
- Lending: displays a list of countries in each lending group.
- Income: lists countries grouped according to income.
- Region: lists countries according to their geographical location.
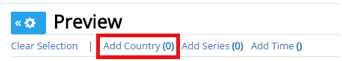
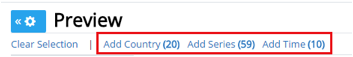
Option 5: Click on Add Country in the Preview panel of the Report page. This will open a new window containing the list of countries. You can then make your selections using any of the first four methods mentioned above.
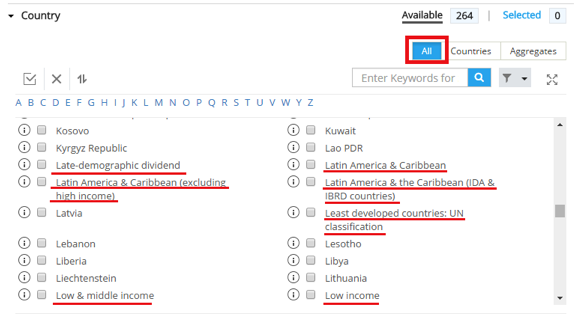
Selecting Aggregates
By default, the country list is generated when you click on the Country section of the Variables tab. To select aggregates, click on the Aggregates button and choose from the list.
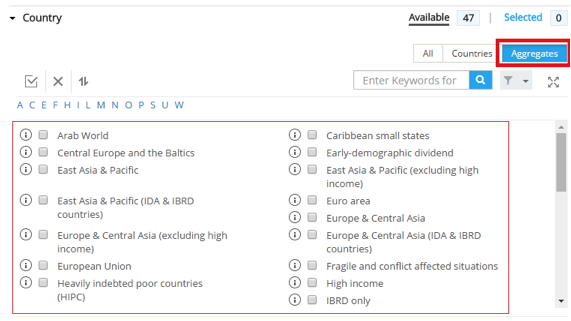
Note: You can have Countries and Aggregates on the same list by clicking on "All". The Aggregates will be mixed with the Country names.
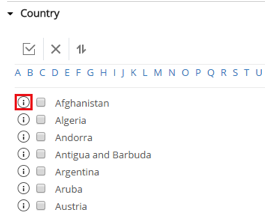
How do I view country and indicator metadata/notes?
Notes containing indicator- or country-specific information can be viewed by clicking on the "information"  icon beside each Country or Indicator name.
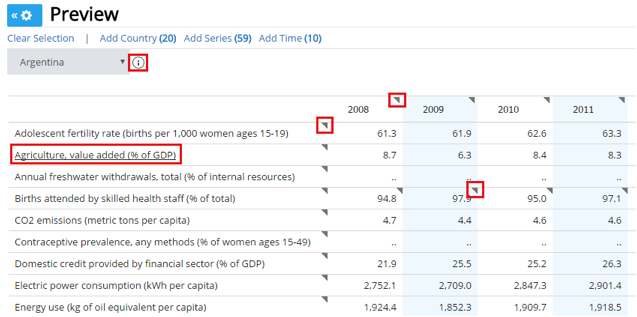
To view metadata in the Preview section of the Report page:
- Click on the on the "information"
 icon beside the dropdown menu.
- Click on the variables in the first column.
- Click on the cells with footnotes. This is denoted by a triangle
 on the upper right corner of the cell.
Note: A message ( ) will appear when you mouse over a selection that contains metadata or notes.
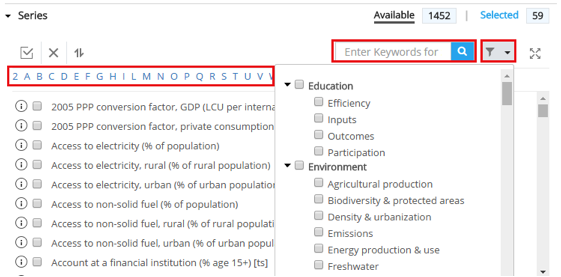
How do I select indicators?
There are five ways to select an indicator:
Option 1: Scroll through the list in the Series section of the Variables tab, then check the boxes to indicate your selection.
Option 2: Click on the first letter of the indicator in the Alphabet bar, then check the boxes to indicate your selection.
Option 3: Type the indicator name or indicator code in the search box, then check the boxes to indicate your selection.
Option 4: Click on the Filter option to narrow down the list of indicators to specific groups and subgroups, then check the boxes to indicate your selection.
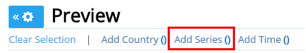
Option 5: Click on Add Series in the Preview panel of the Report page. This will open a new window containing the list of indicators. You can then make your selections using any of the first four methods mentioned above.
How do I select the years?
There are four ways to select years:
Option 1: Select the time span by using the year range slider in the Time section of the Variables tab.
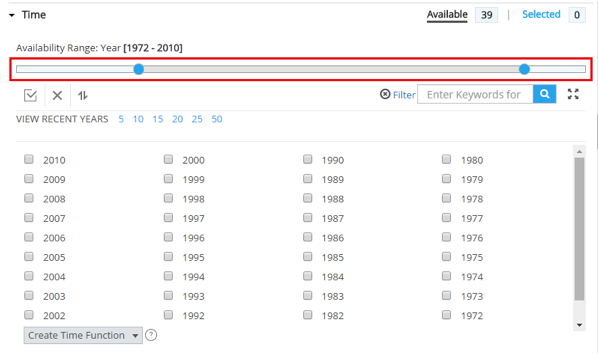
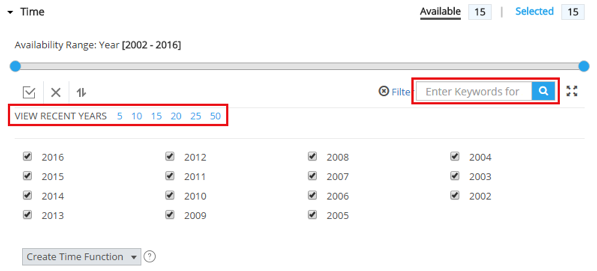
Option 2: Enter the year in the Search box, or use the filters: View Recent Years: 5, 10, 15, 20, 25, 50.
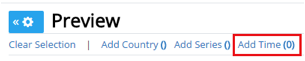
Option 3: Click on Add Time in the Preview panel of the Report page. This will open a new window containing the list of years. You can then make your selections by using the year range slider, filter, or search box.
How do I create a Custom Time Function?
You can create a customized time function by clicking on Create Time Function. Enter a Title and select the parameters for the Type of operation and Span of years, then click Add.
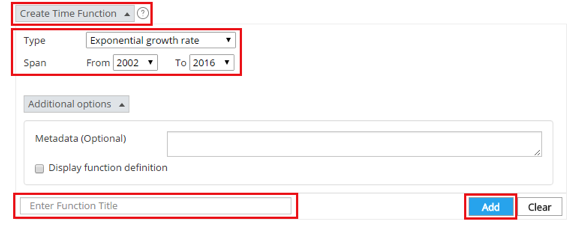
Note: The operation will be performed on all selected series and may generate inaccurate results (e.g., growth rates on current price series). Please observe caution when using this function.
For more information on creating a time function, click on the "help"  icon.
icon.
How do I edit the list of countries, indicators and years I have selected?
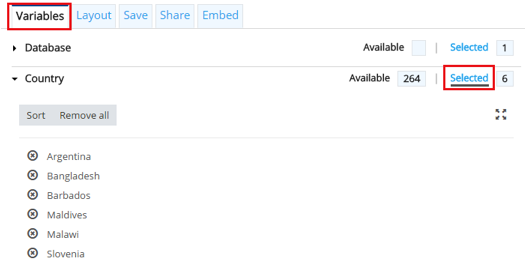
You can edit your selections by clicking on Selected in the Country, Series, and Time sections of the Variables tab.
How do I delete a country, indicator, or year from my selection?
To delete anything from your selection list, click on the "x" to the left of the indicator, country or year. You can also click on Remove all if you wish to delete all the entries from your selection.
How do I change the order of variables in the table or chart?
There are two ways to do this:
1. Select the indicator, country or year and drag to rearrange the order.
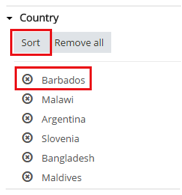
2. Click the Sort button. This will sort the countries/indicators alphabetically and years chronologically.
Click on Apply Changes when done editing.
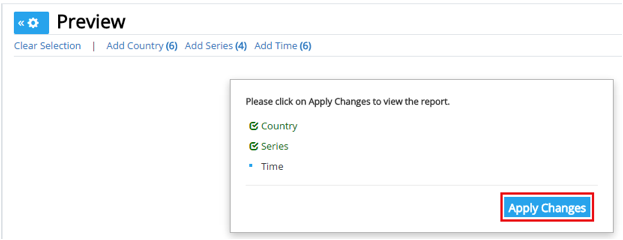
How do I view all the data I have selected?
Your variable selections will not be reflected automatically. In order to view your data, click on Apply Changes.
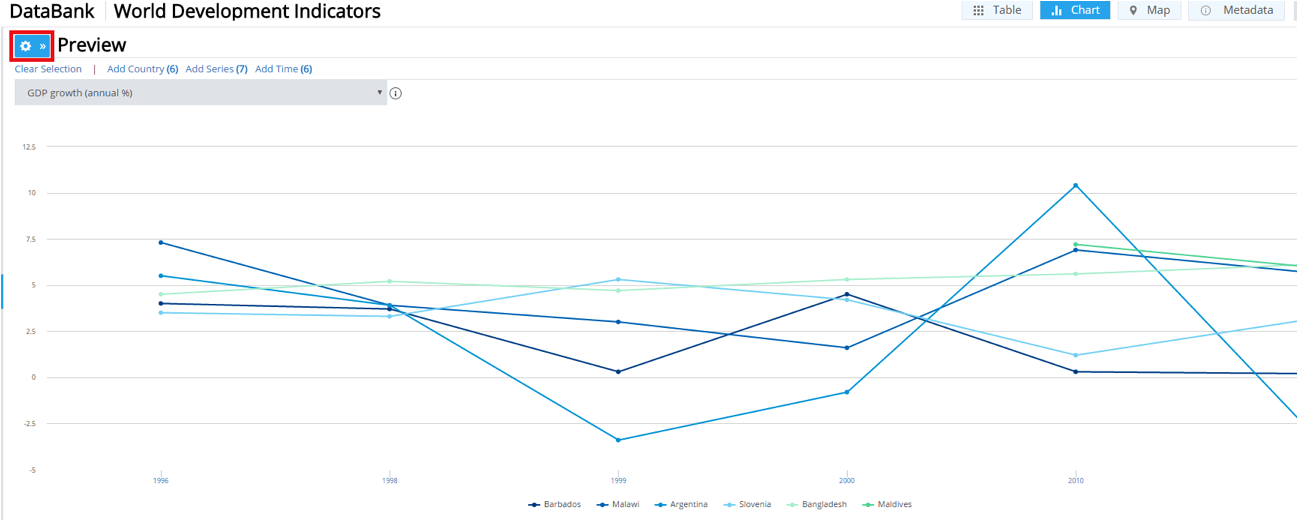
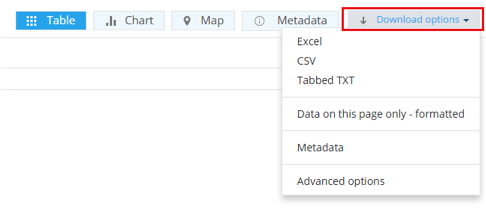
You can view the data as a Table, Chart, Map, or Metadata. You also have the option to download the data file in a number of formats (Excel, CSV, and Tabbed TXT). When you have finished making selections of countries, indicators and years, choose one of the viewing options on the toolbar on top of the page.

Additional viewing options
When viewing your table, chart or map, you can expand the display by clicking on the "show/hide options"  button.
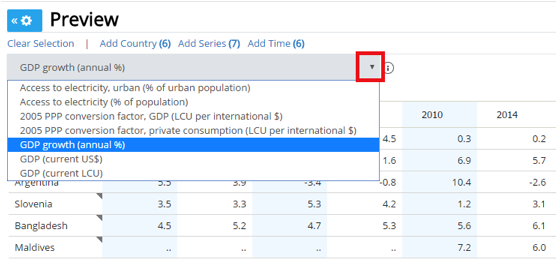
Why doesn't the table show all the data?
By default the table shows the variables (country, indicator, time) by row, column, and page. To view the data for the variables in the page dimension, click and select from the dropdown menu.
How do I customize my table?
You can customize the way data is displayed by clicking on the Layout tab. Here you can change the data Orientation, increase or decrease the number of rows Displayed per page, Format Numbers, and add Table Headers and Footers. Once you have selected the changes you would like to make, click on Apply Changes.
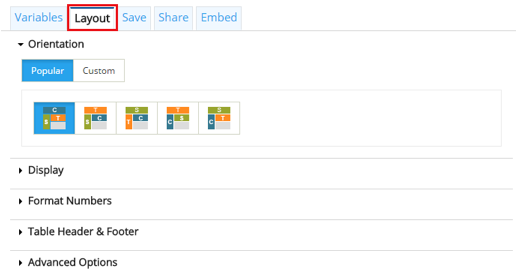
Table Orientation
You can choose from Popular table orientation presets or choose Custom orientation. Custom orientation lets you assign positions for your selected variables. You can do this by rearranging the order of the series, country, and time, or by selecting from the dropdown menu.
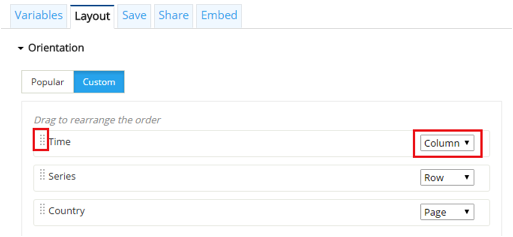
Click on Apply Changes for your changes to be reflected.
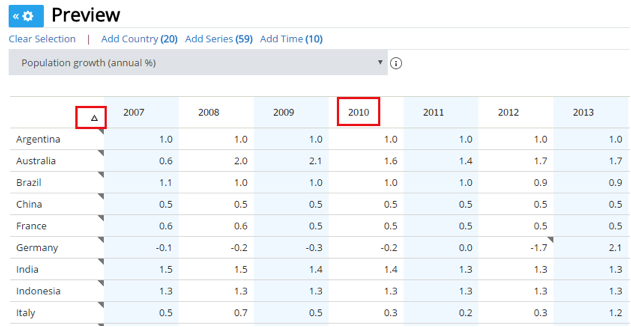
Sorting data on your table
Once you have generated your table, you can sort the data alphabetically or numerically by clicking on the column header.
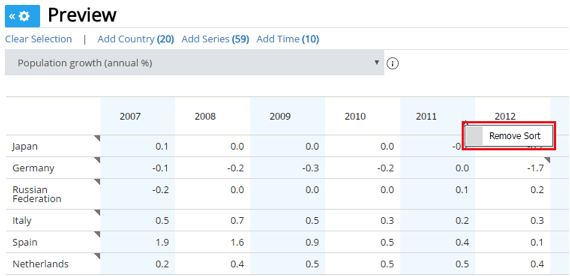
To remove sort, right-click on the column header and select Remove Sort.
Why doesn't the chart show all the data?
By default the chart shows the variables (country, indicator, time) by X-axis, Y-axis, and Page. To view the data for the variables in the Page display, click and select from the dropdown menu.
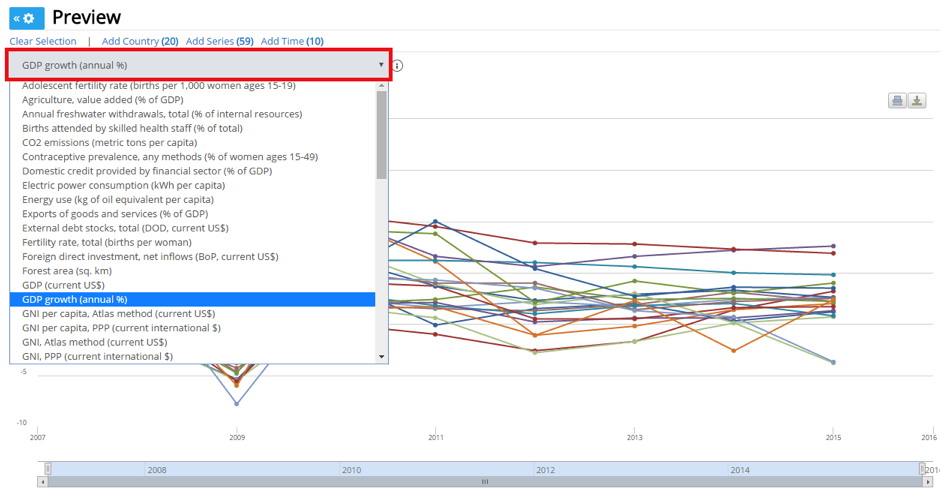
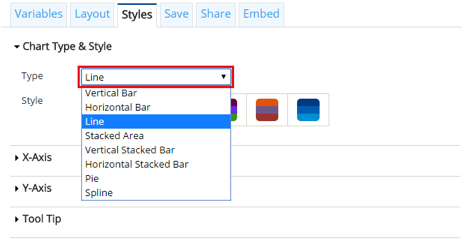
How do I choose the type of chart for visualizing my data?
The default chart type is a line chart. You can change this by choosing from the dropdown menu located in the Chart Type & Style section of the Styles tab. Click on Apply Changes in order for the new chart to be displayed.
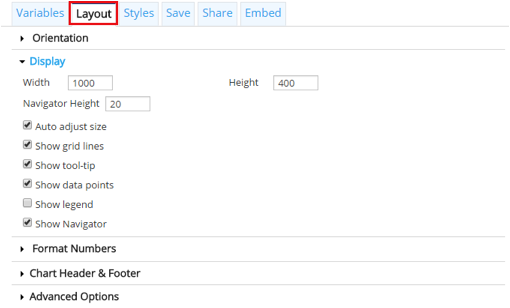
How do I customize my chart?
You can customize the way data is displayed by clicking on the Layout tab. Here you can change the data Orientation, adjust the Display, Format Numbers, and add Chart Header & Footer. Once you have selected the changes you would like to make, click on Apply Changes.
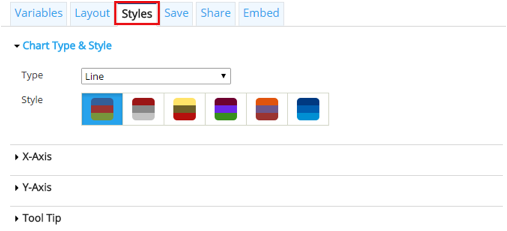
What are the other chart customization options?
The Styles tab lets you modify the appearance of your chart. Here you can change chart style and color, as well as edit the way data is presented in the X-Axis and Y-Axis.
How do I view metadata in a chart?
Click on the "information"  icon beside the dropdown menu to view the metadata for the displayed variable. Additional information will also be displayed when you mouse over the data points on your chart.
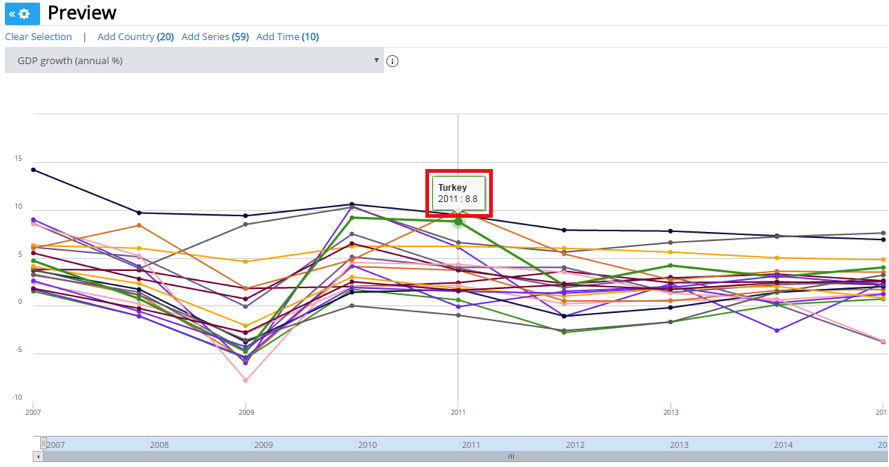
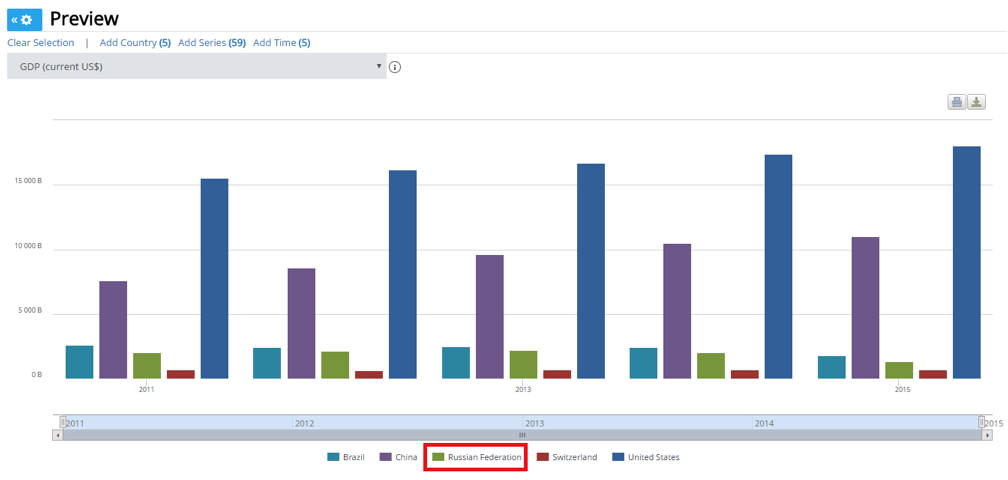
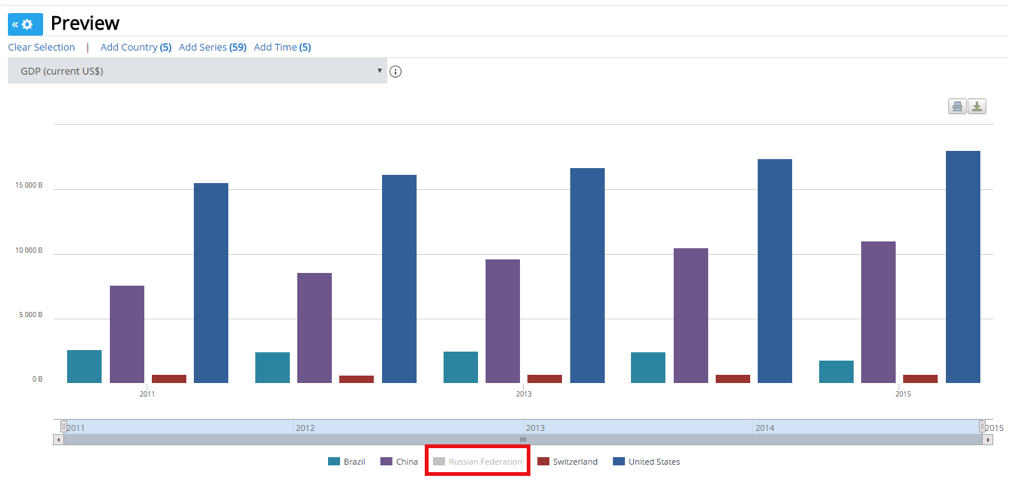
When viewing your chart, you can choose which data to include or hide by clicking on the Legend.
How do I customize my map?
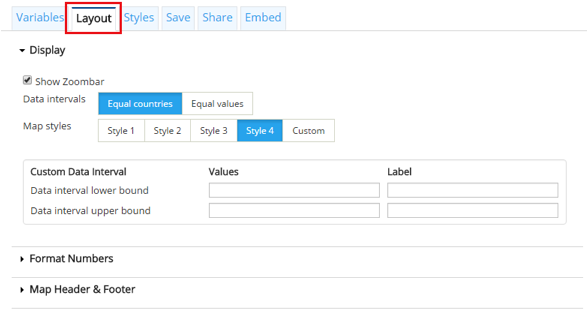
You can customize the way data is displayed by clicking on the Layout tab. Here you can change the Data Intervals, choose Map Styles, set a Custom Data Interval, Format Numbers, and add a map header or footer. Once you have selected the changes you would like to make, click on Apply Changes.
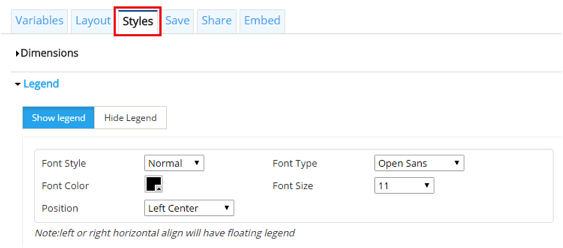
You can also click on the Styles tab to modify the appearance of your map. Here you can adjust the Dimensions and design the Legend. Once you have selected the changes you would like to make, click on Apply Changes.
How do I use the map?
Viewing Data
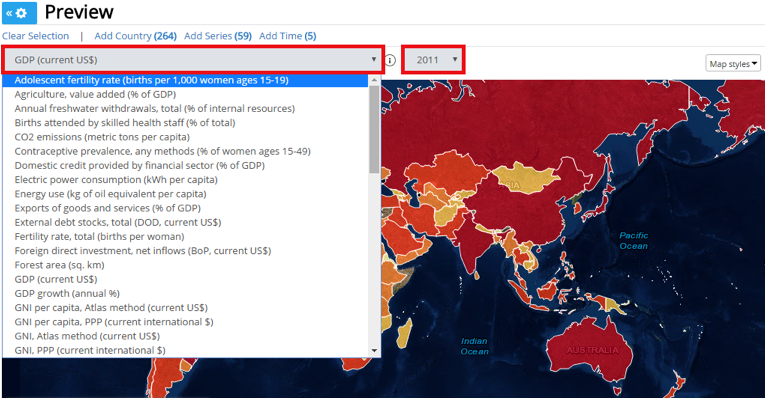
The Preview panel of the Report page shows you data for all the countries using one indicator and year at a time. You can change the indicator and year by selecting from the two dropdown menus at the top of the map.
Viewing Additional Information
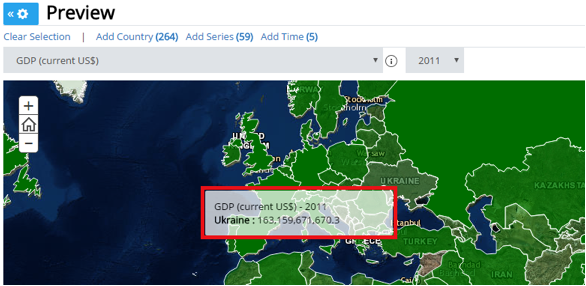
When you mouse over/hover over a country, the indicator data for that country will automatically pop up.
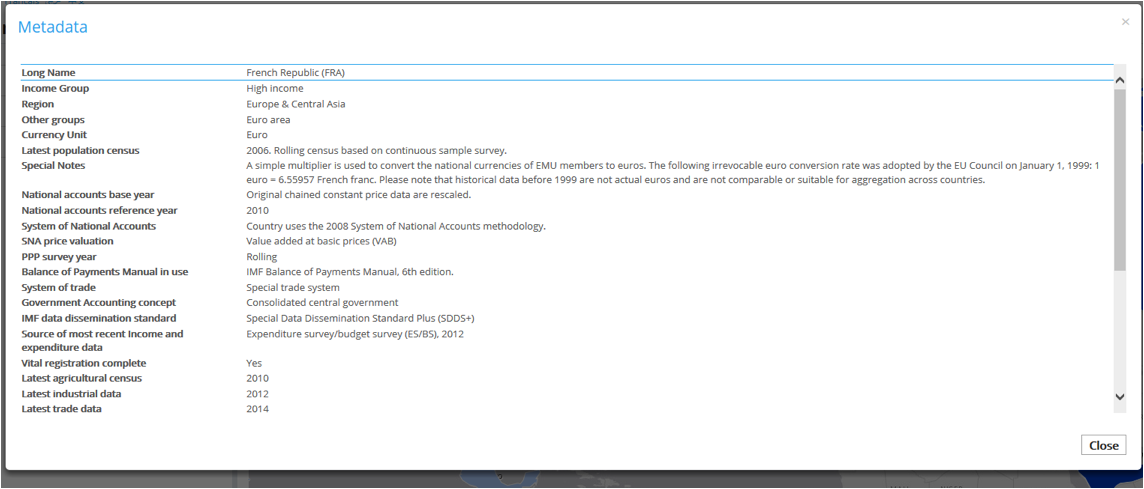
Clicking on a country will generate the metadata.
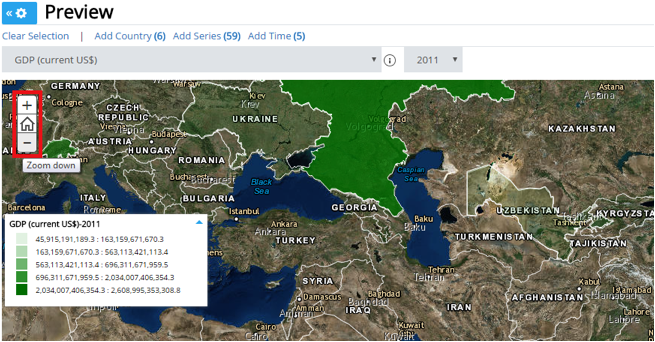
Navigating the map
To view a particular country or region, click+hold on the map and pan left or right until you find the country of your choice. You can also zoom in/out by either using the zoom bar or a mouse wheel.
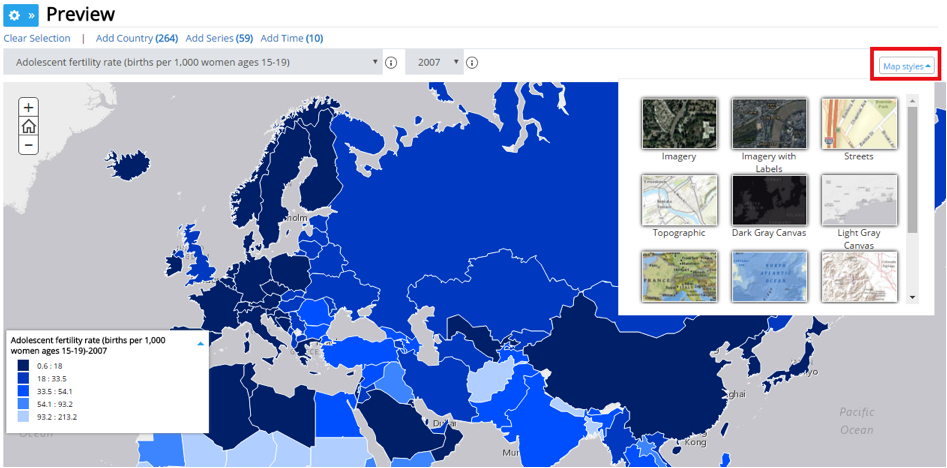
Changing the map display
The default map used is a Light Gray Canvas. To change this, click on Map Styles on the top right of the map and select from twelve different map options.
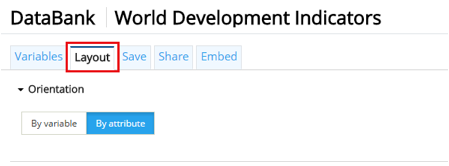
How do I view the metadata?
You can customize the way Metadata is displayed by clicking on the Layout tab. Here you can choose to view data By Variable or By Attribute.
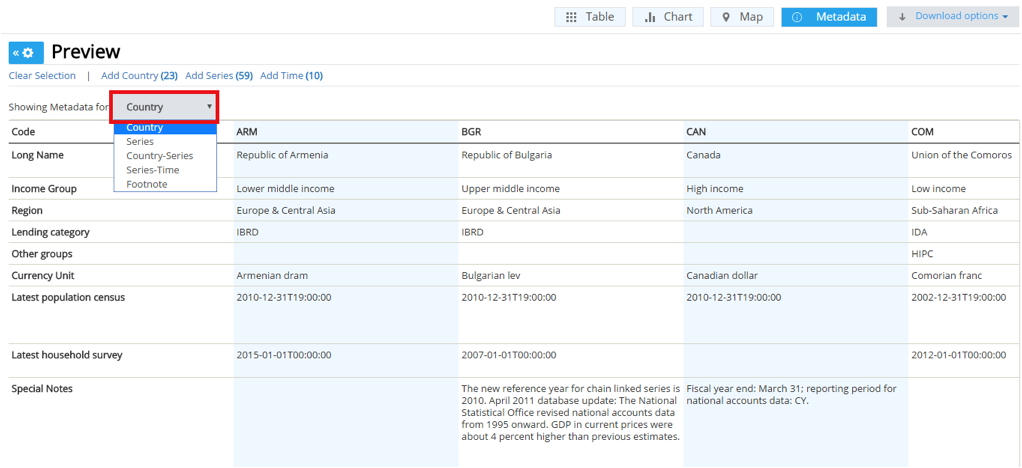
You can also choose the type of Metadata to be displayed in the Preview panel of the Report page by selecting from the dropdown menu.
How do I edit my selections once I have the Table, Chart or Map open?
You can always edit your selections while viewing your data. Just click on the Variables tab and go to the section you want to edit. Once you are satisfied with your edits, click on Apply Changes.
Another way to edit your selections is by clicking on Add Country, Add Series, or Add Time in the Preview panel of the Report page. Clicking on these will generate a pop-up window where you can edit your selections. Once you are satisfied with your edits, click on Apply Changes.
How do I download Data?
You can download the data to your computer by clicking on Download Options from the toolbar. Select the format for your report (Excel, CSV, TXT, or SDMX) and it will automatically be downloaded.
How do I save, access and delete my reports?
Save Reports
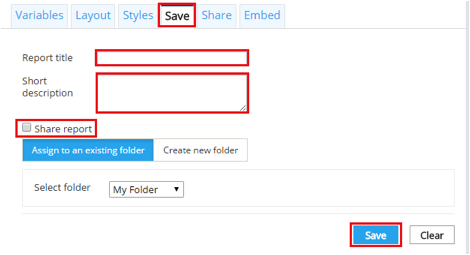
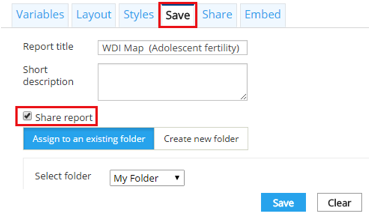
First, you must sign in to DataBank as a registered user. Once you have generated a table, chart or map, click on the Save tab. Enter a Report title (required) and a Short description (optional), and then create a new folder or select an existing one in which to save your data. You can select Share report if you want the data to be visible to other DataBank users once the URL is shared with them. When you are done, click Save. Your report is now available for future use and customization.
Access Saved Reports
You can access your reports from the DataBank Homepage by clicking on the Saved Reports button on the left side of the page and opening the My Reports tab.

Delete Reports
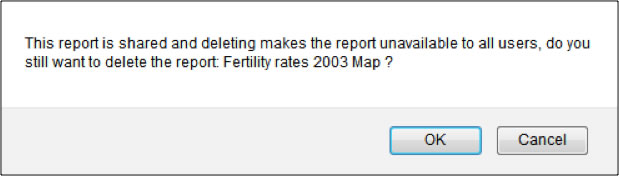
Select a saved report from the My Reports tab and click Delete. A warning message will pop up to confirm this action as it cannot be undone.
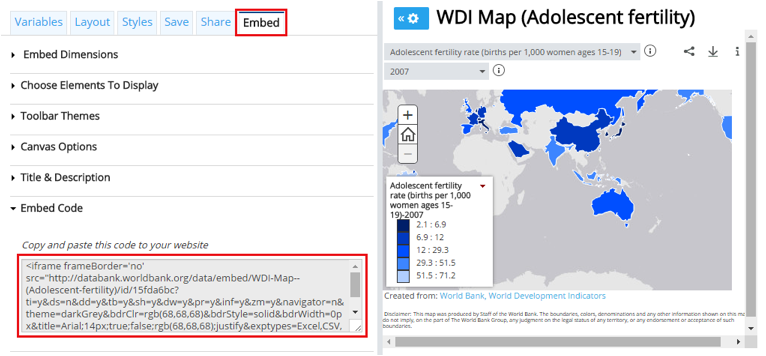
How do I embed tables, charts and maps?
You can embed and customize your report by clicking on the Embed tab and setting the attributes (Display, Themes, Canvas Options, and Title & Description). When you are done, copy the embed code and drop it in the blog or website.
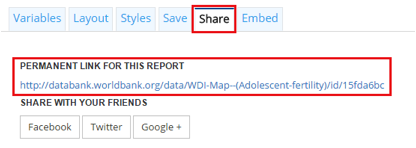
How do I share a report?
When saving your report, save it with Share Report checked.
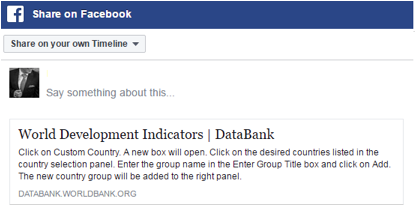
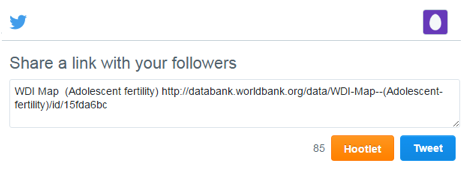
Click on the Share tab and you will be provided with a link to your saved report. You can also share the report on Facebook, Twitter, and Google+ by clicking on their respective buttons.
Clicking on the Facebook, Twitter, and Google+ buttons will open a new window where you can directly share your report in your chosen social media platform.